Axisless
Real data, played and drawn.
New puzzles every day at midnight, plus charts and stories about the numbers.
Pick a category
A bit of everything: every world, small boards included, one chart a day.
Countries and regions coloured by real numbers, from coffee to chess players to how long people live.
Organs, bones, injuries, teeth and chromosomes: which cancers people survive, which bones break on the stairs.
Pokémon, Mario Kart, Snakes and Ladders, Monopoly, cards and chess, by the numbers.
Stories
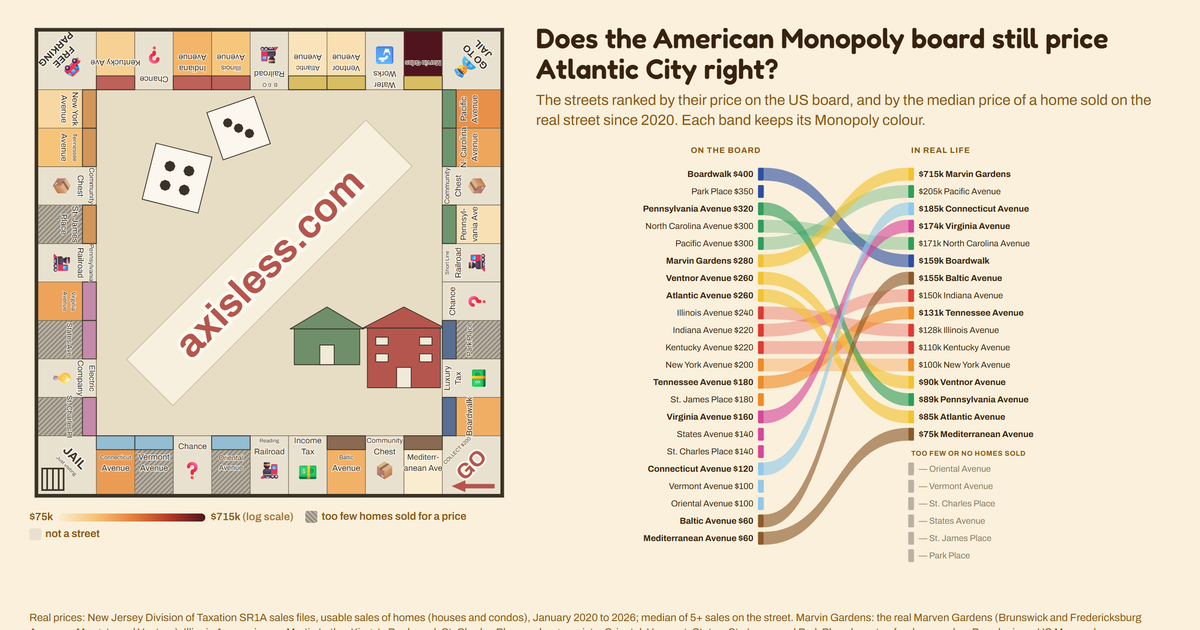
Monopoly, priced for real
Every street on the London and Atlantic City boards, priced from real home sales, then checked against London in 1898 and Atlantic City in 1930. Was the board ever right?
Read the storyExplore
Visualisations
The numbers behind the puzzles.
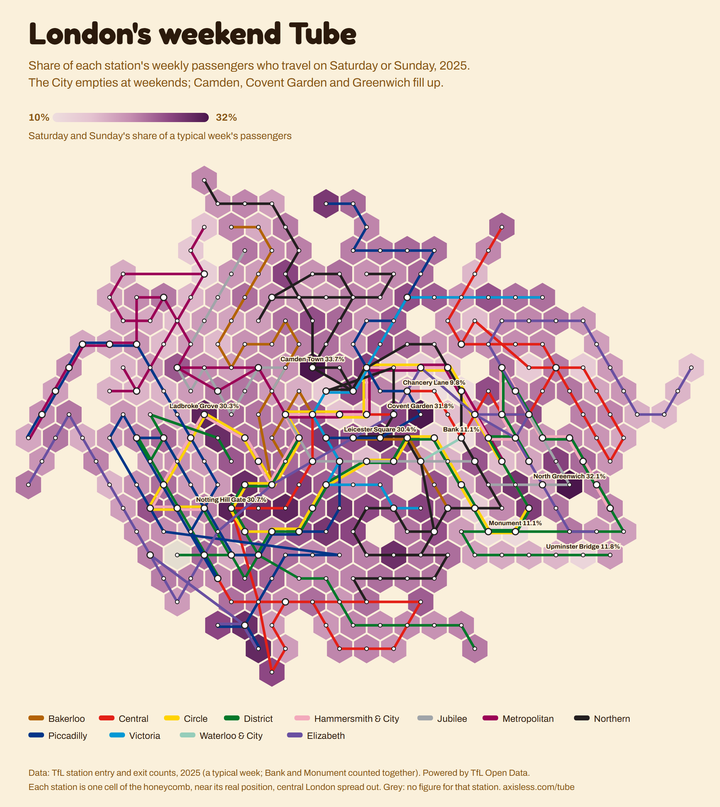
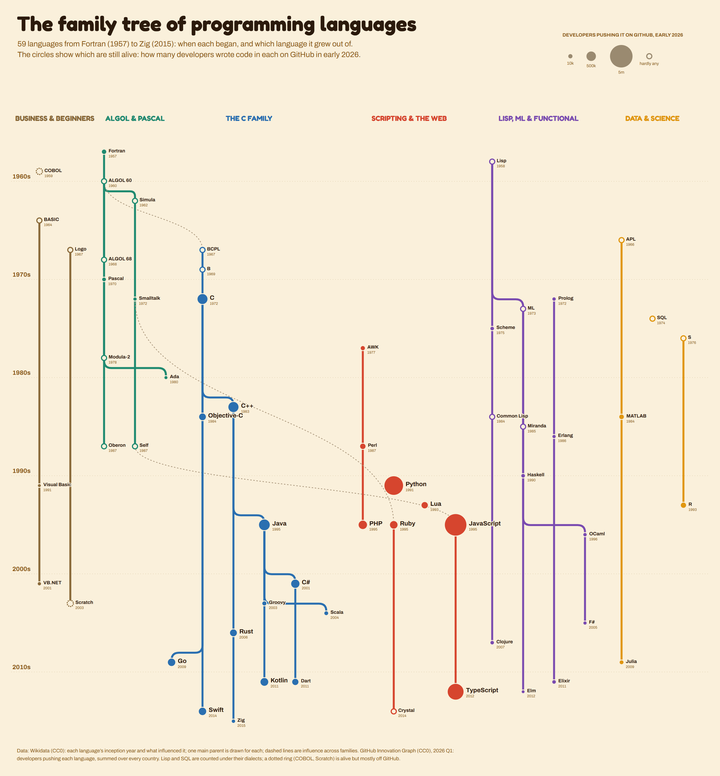
Charts drawn from real data: the Tube as a honeycomb, the family tree of programming languages, Monopoly against real London house prices, and more.


Open source
The honeycomb Tube
The code that turns London's rail network into a honeycomb, one cell per station, with the lines drawn through. Free to use.
Monopoly, priced for real
The data pipeline behind the Monopoly story: Land Registry, New Jersey sales, the 1930 census and Booth's 1898 map.