Every US state’s twin country
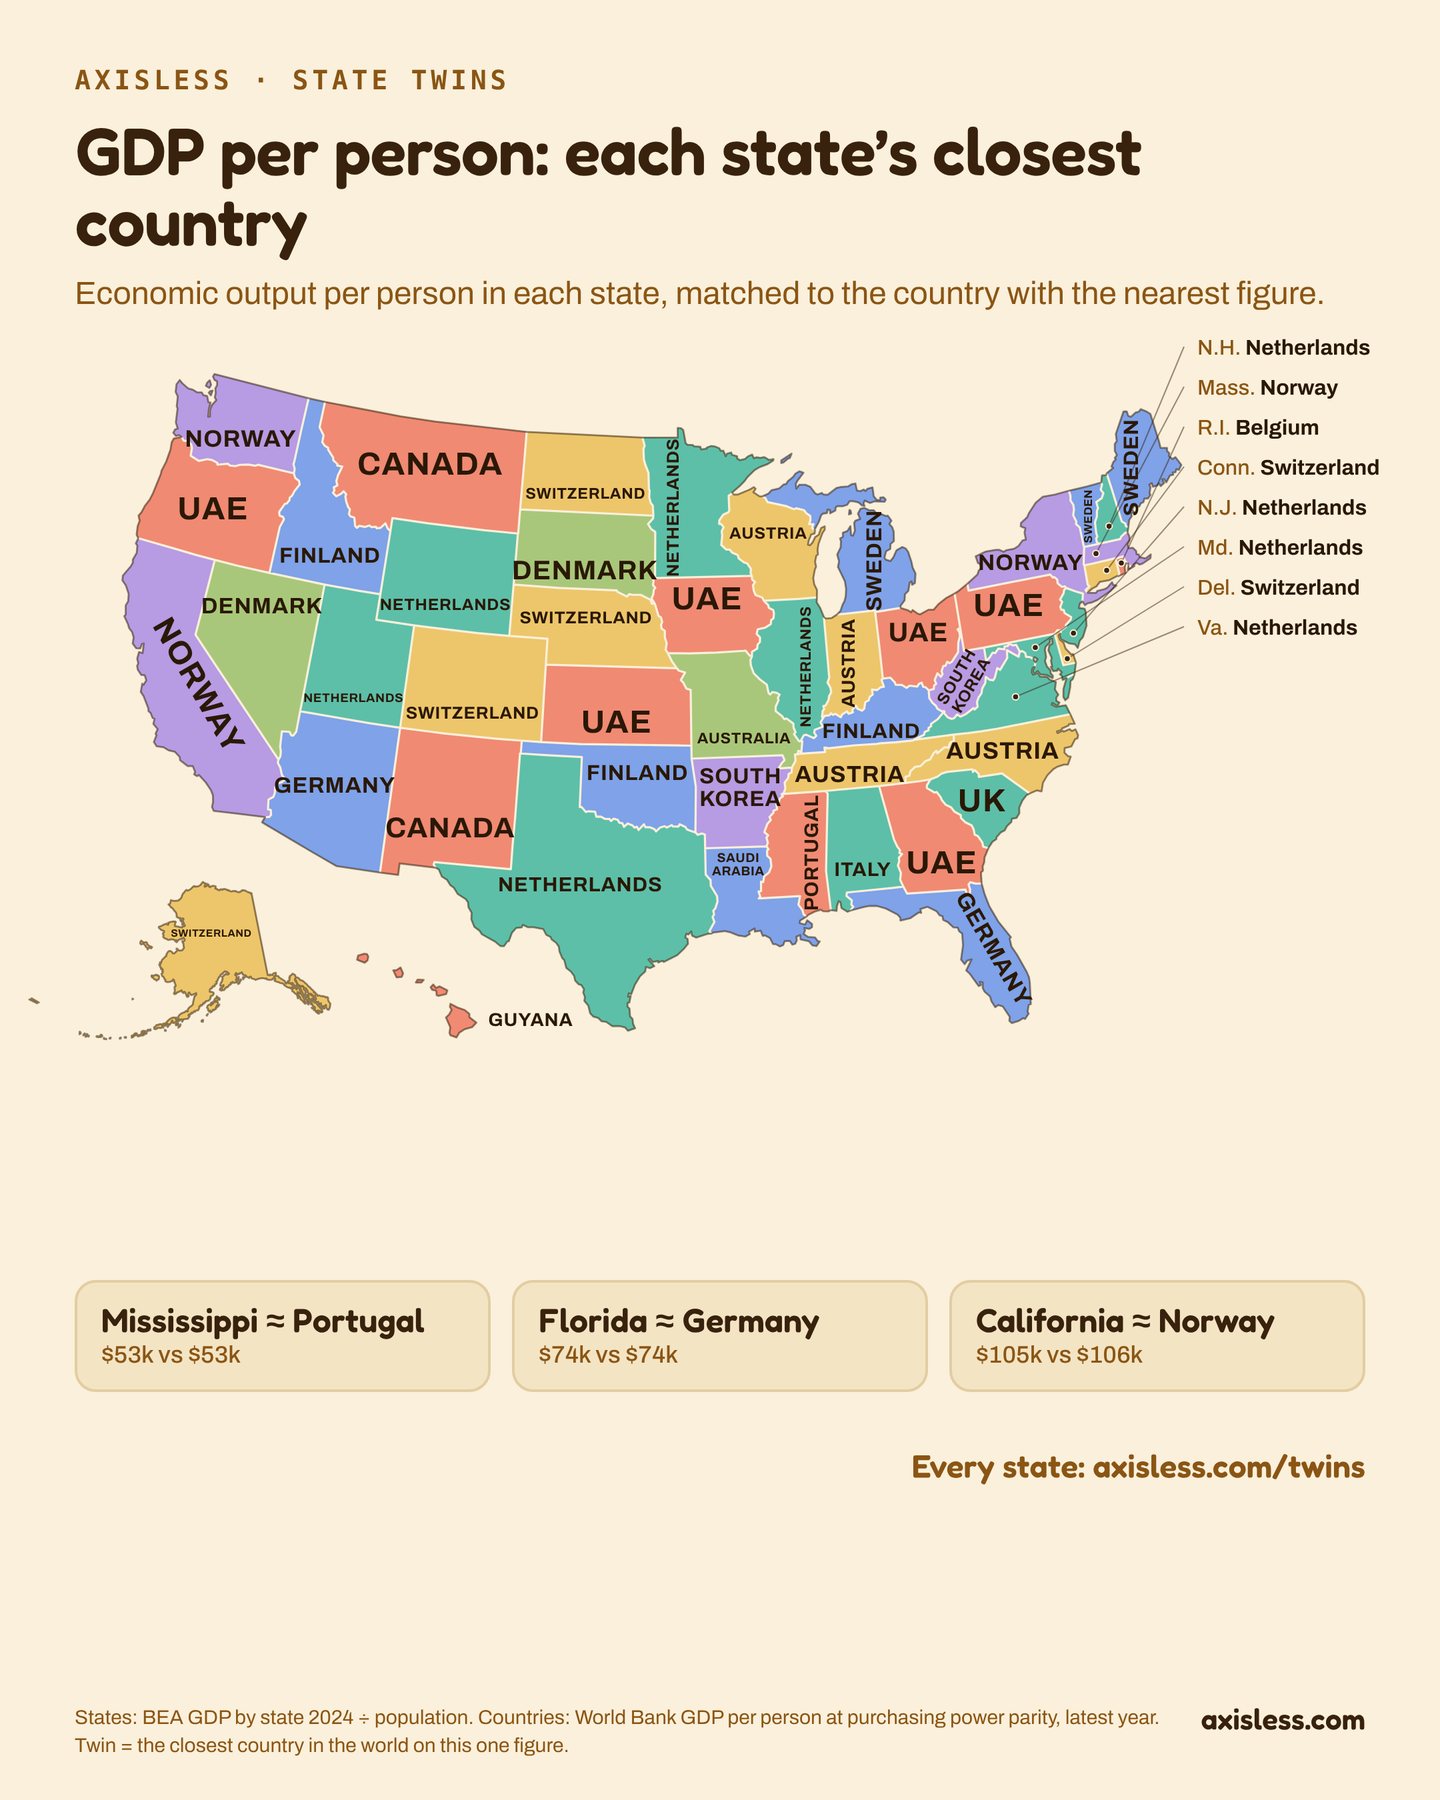
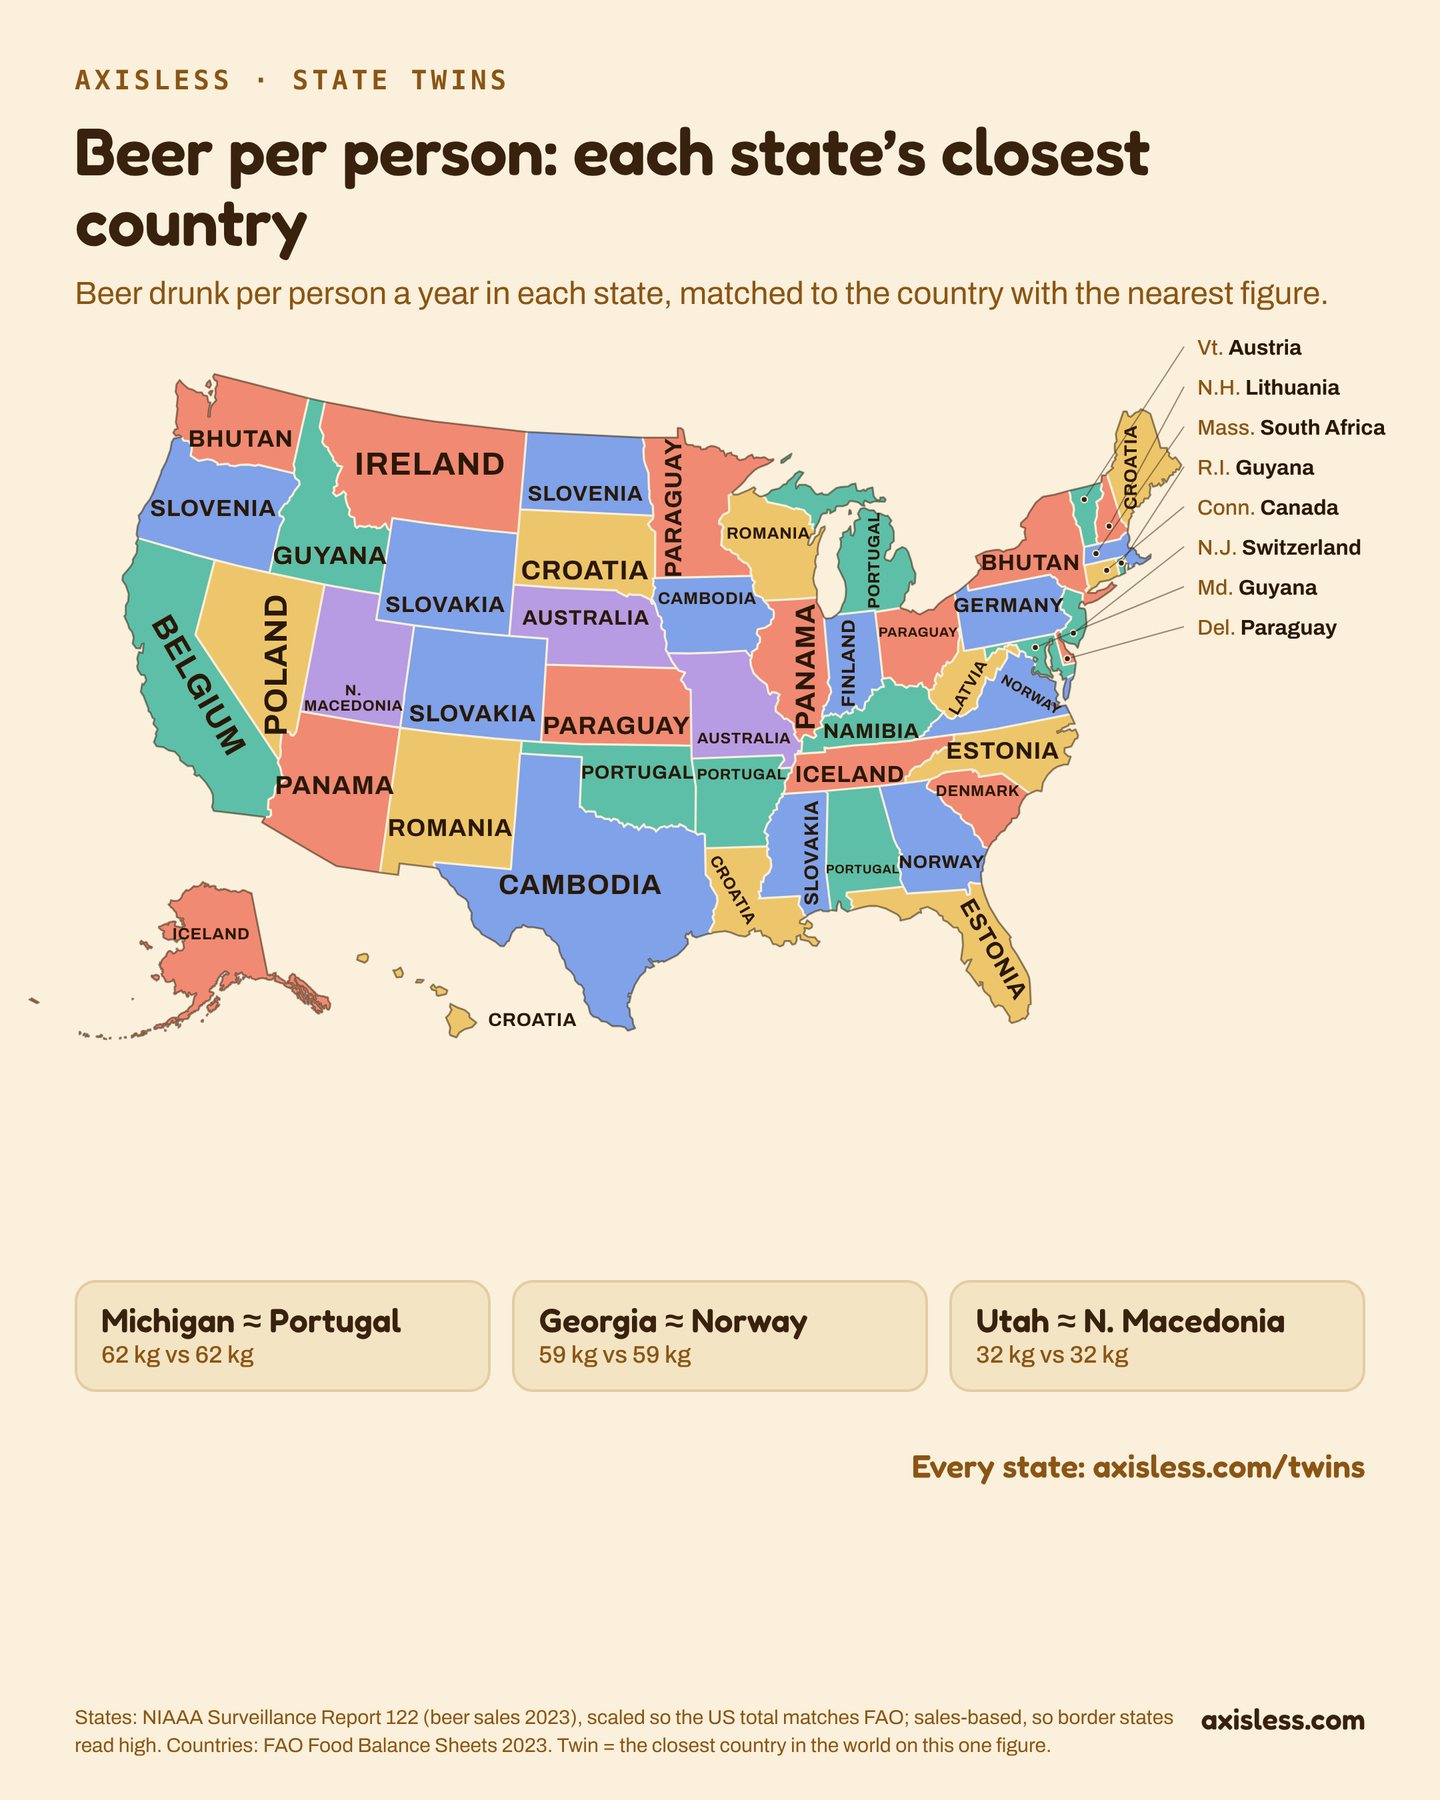
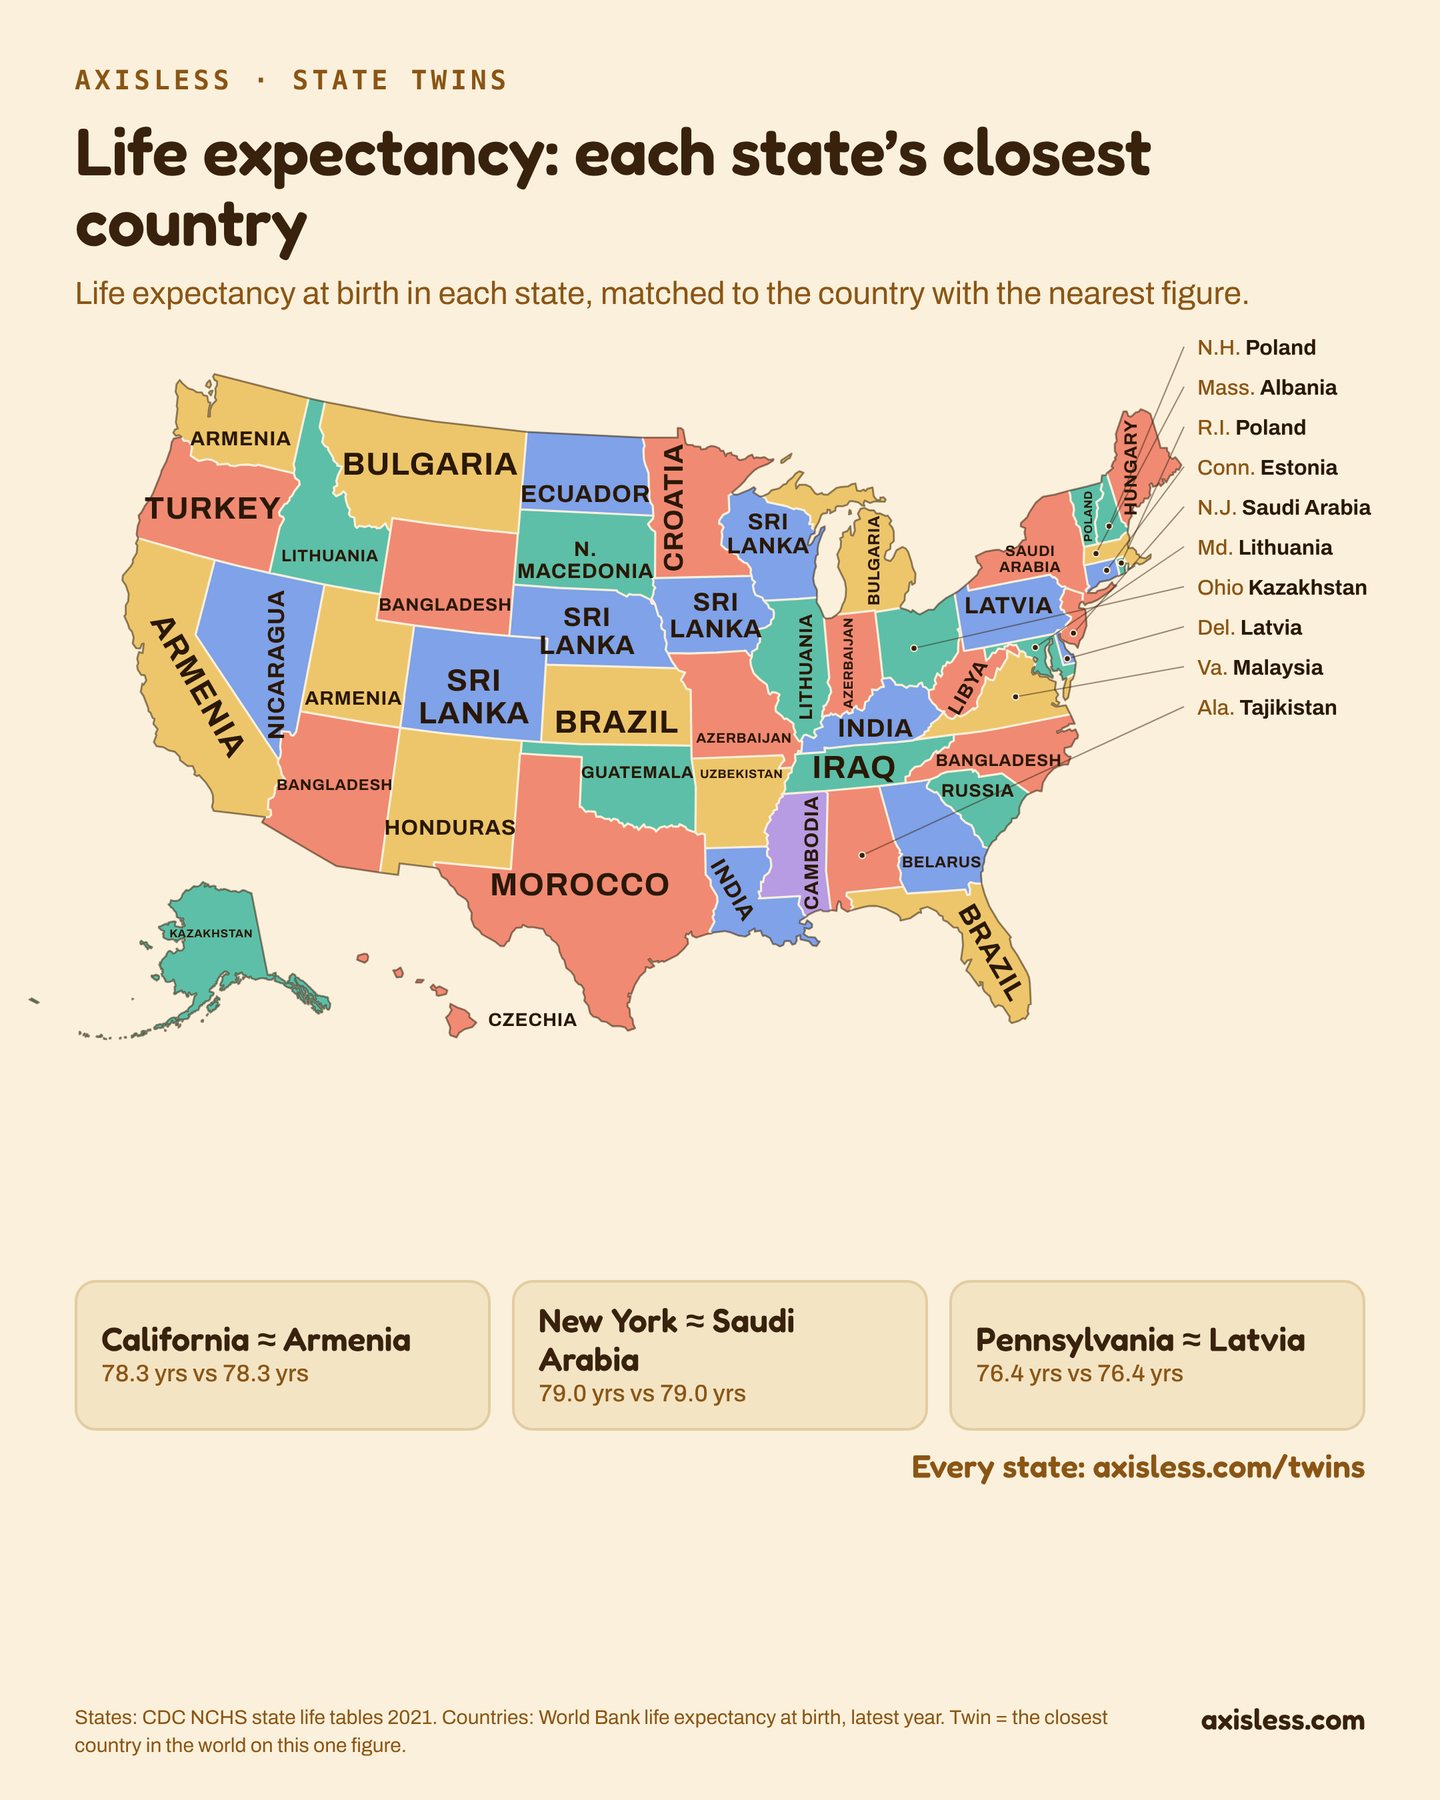
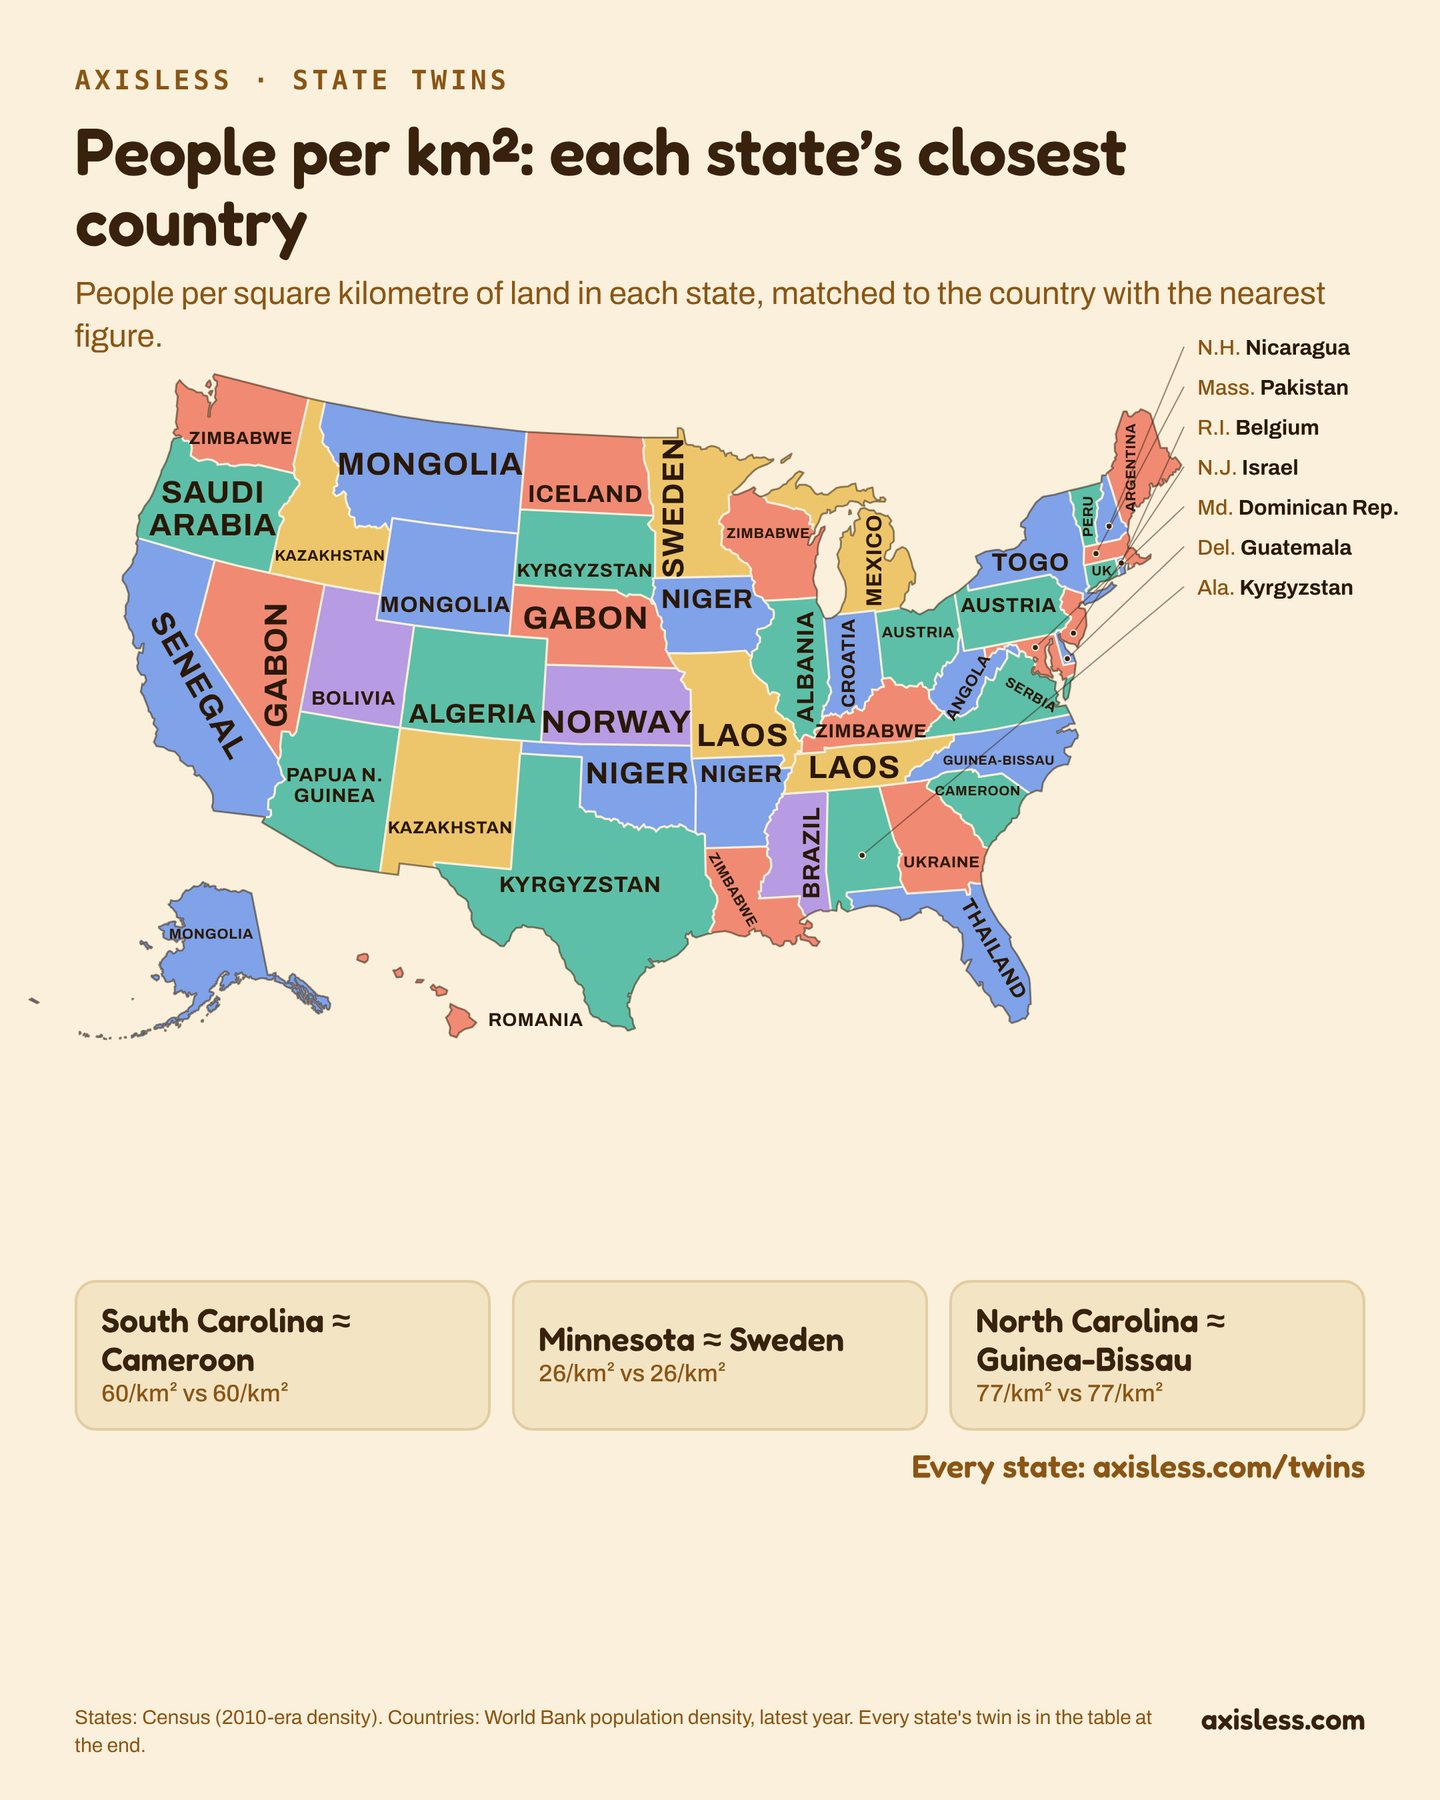
Each state matched to the country with the nearest figure, one per-person measure at a time, so a state’s twin changes from map to map. Neighbouring states with the same twin share a colour; otherwise the colours only keep neighbours apart.
| State | GDP per person | Beer per person | Life expectancy | People per km² |
|---|
Under each twin: the state’s figure, then the twin’s. “Also” lists countries the data can’t tell apart from the twin; otherwise “next” is the runner-up.
How it was made
- GDP per person. States: US Bureau of Economic Analysis, 2024, divided by population. Countries: World Bank, GDP per person at purchasing-power parity, latest year. State figures are in plain dollars, countries adjusted for local prices.
- Beer per person a year. States: NIAAA Surveillance Report 122, beer sales in 2023, scaled so the US total matches FAO. Countries: FAO Food Balance Sheets, 2023. Sales-based, so border and tourist states (New Hampshire, Montana, Nevada) read high.
- Life expectancy at birth. States: CDC NCHS state life tables, 2021. Countries: World Bank, latest year.
- People per square kilometre of land. States: US Census (2010-era). Countries: World Bank, latest year.
- Only independent countries are matched, so not Greenland, Western Sahara or the Falklands. Washington DC is left out.
Maps drawn with d3-geo and TopoJSON from US Census state boundaries. Download every state’s twins (JSON).