Which areas of England and Wales have lost the most pubs?
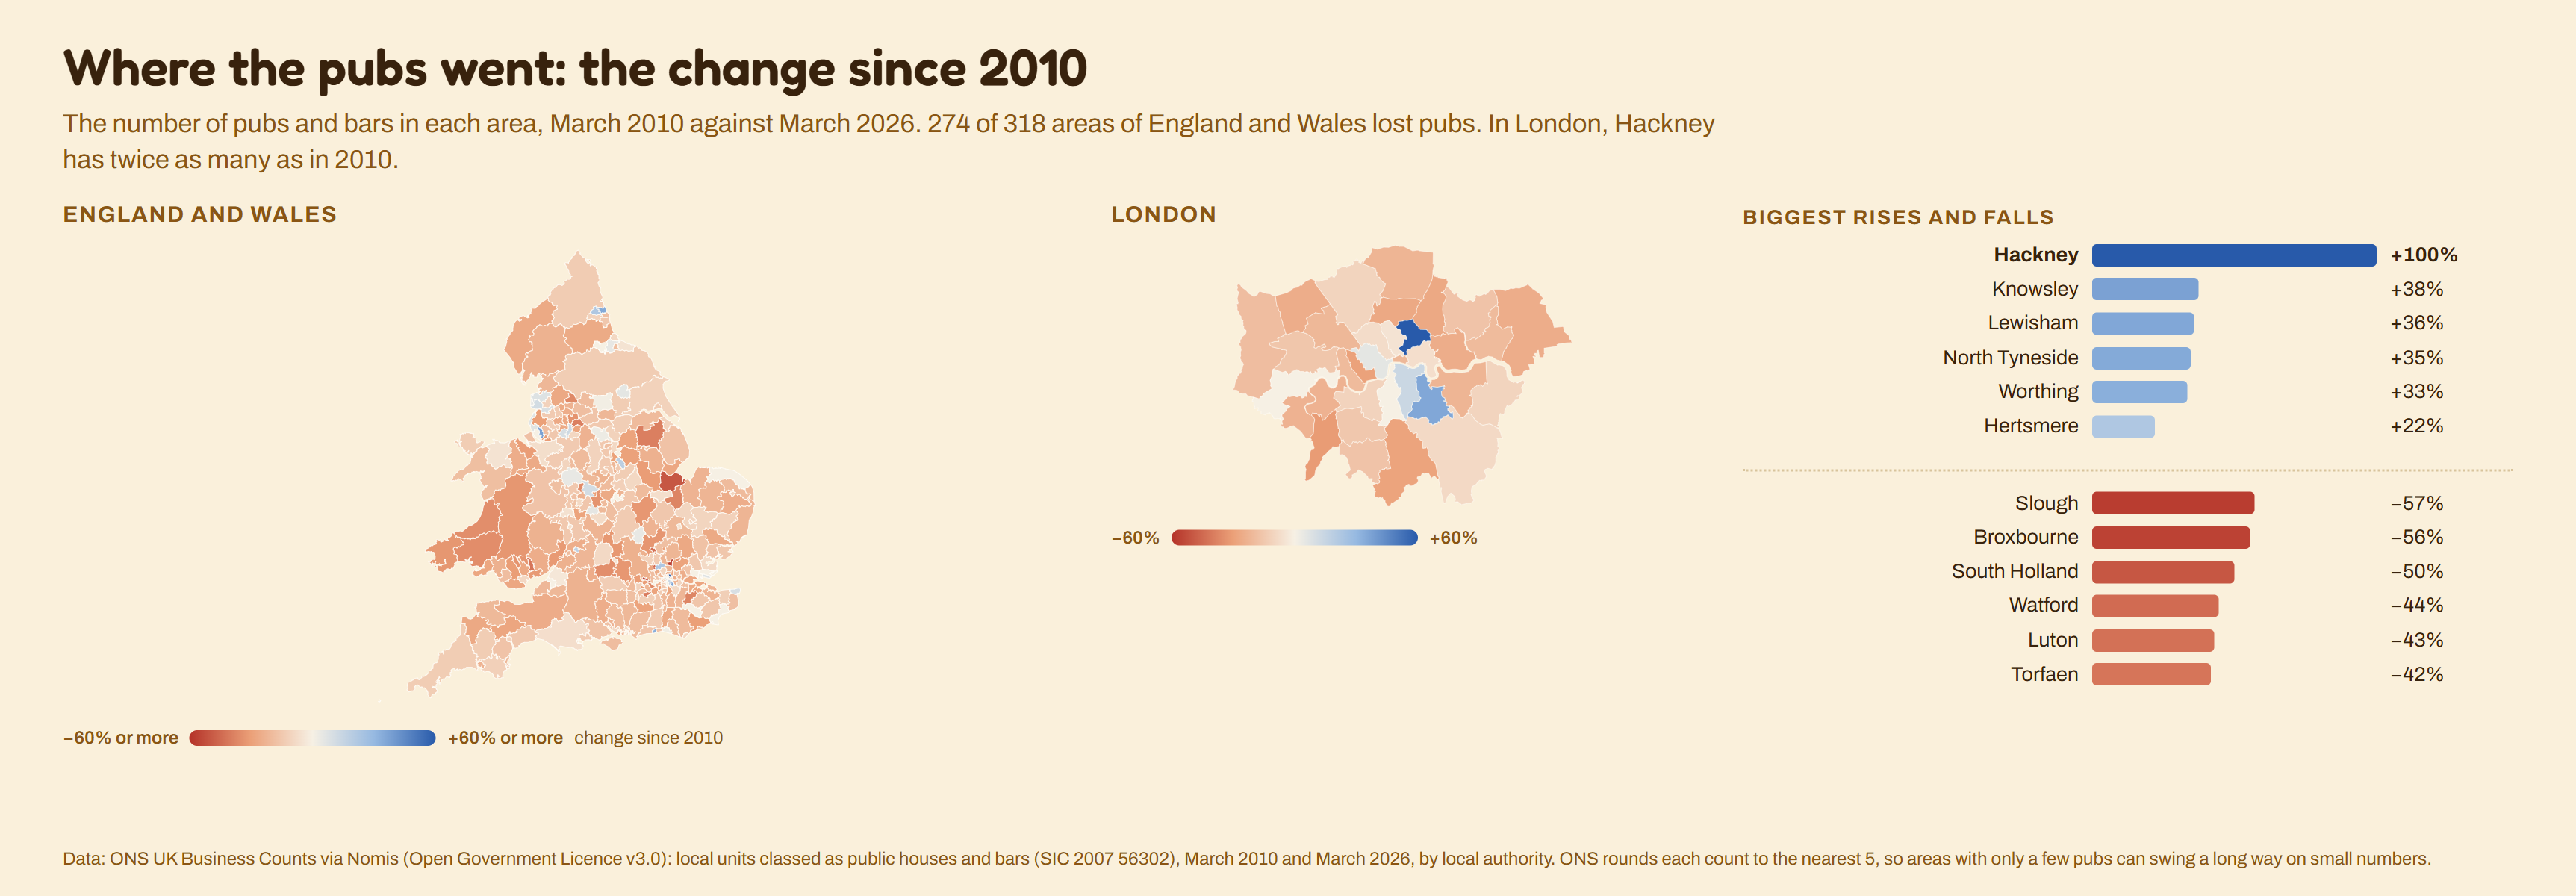
The change in the number of pubs and bars in every area of England and Wales between 2010 and 2026. Most areas lost pubs; in London, Hackney has twice as many as it had.
Source: ONS UK Business Counts via Nomis, March 2010 and March 2026.
What stands out
- Outside London the biggest rise is Knowsley’s, +38%, then North Tyneside (+35%) and Worthing (+33%).
- Slough lost the biggest share of its pubs, −57%, then Broxbourne (−56%) and South Holland (−50%).
- Only 29 of the 318 areas have more pubs than in 2010; 15 have the same number.
- In London, 27 of the 33 boroughs lost pubs, Kingston upon Thames most (−31%).
The numbers
| Rank | Area | Change since 2010 |
|---|---|---|
| 1 | Hackney | +100% |
| 2 | Knowsley | +38% |
| 3 | Lewisham | +36% |
| 4 | North Tyneside | +35% |
| 5 | Worthing | +33% |
| 6 | Newcastle upon Tyne | +22% |
| 6 | Hertsmere | +22% |
| 8 | Gedling | +18% |
| 9 | Cheltenham | +18% |
| 10 | Southwark | +14% |
| … | ||
| 11 | Manchester | +13% |
| 29 | Leeds | +1% |
| 30 | Liverpool | 0% |
| 67 | Cardiff | −10% |
| 129 | Birmingham | −16% |
| … | ||
| 308 | Tonbridge and Malling | −38% |
| 310 | West Lindsey | −39% |
| 311 | Oldham | −39% |
| 312 | Woking | −40% |
| 313 | Torfaen | −42% |
| 314 | Luton | −43% |
| 315 | Watford | −44% |
| 316 | South Holland | −50% |
| 317 | Broxbourne | −56% |
| 318 | Slough | −57% |
The top 10 and bottom 10 of 318, with others for comparison.
| Rank | Borough | Change since 2010 |
|---|---|---|
| 1 | Hackney | +100% |
| 2 | Lewisham | +36% |
| 3 | Southwark | +14% |
| 4 | Westminster | +6% |
| 5 | Hounslow | 0% |
| 5 | Lambeth | 0% |
| 7 | Islington | −5% |
| 8 | Tower Hamlets | −7% |
| 9 | Camden | −8% |
| 10 | Bromley | −9% |
| 11 | Barnet | −11% |
| 11 | Bexley | −11% |
| 13 | Wandsworth | −11% |
| 14 | Merton | −15% |
| 15 | Ealing | −16% |
| 16 | Redbridge | −17% |
| 16 | Sutton | −17% |
| 18 | Hillingdon | −19% |
| 19 | Barking and Dagenham | −20% |
| 19 | Hammersmith and Fulham | −20% |
| 21 | City of London | −21% |
| 21 | Brent | −21% |
| 23 | Enfield | −22% |
| 23 | Greenwich | −22% |
| 25 | Richmond upon Thames | −23% |
| 26 | Harrow | −25% |
| 26 | Havering | −25% |
| 26 | Newham | −25% |
| 29 | Haringey | −27% |
| 29 | Waltham Forest | −27% |
| 31 | Croydon | −29% |
| 32 | Kensington and Chelsea | −29% |
| 33 | Kingston upon Thames | −31% |
Download the chart as an image
Data: ONS UK Business Counts via Nomis (Open Government Licence v3.0): local units classed as public houses and bars (SIC 2007 56302), March 2010 and March 2026, by local authority. ONS rounds each count to the nearest 5, so areas with only a few pubs can swing a long way on small numbers. Played as puzzles in Daily Shade.