What do rich and poor households buy differently?
The richest fifth of UK households spend 3.8 times as much on wine as the poorest fifth, the biggest gap of any supermarket aisle. Tobacco goes furthest the other way: the richest spend 0.3 times as much, under a third. Milk and crisps are the only other aisles where the poorest fifth spend more.
Source: ONS, Family spending in the UK, April 2024 to March 2025.
What stands out
- After wine, the biggest gaps are medicines and health products (2.83×) and pet food, pet supplies and vet bills (2.54×).
- Beer and cider: the richest fifth spend 2.00× what the poorest do.
- Fizzy drinks and squash (1.04×) and crisps and oven chips (0.96×) come closest to even.
- On half the 30 aisles the richest fifth spend at least 1.65× as much.
The numbers
| Rank | Aisle | Richest fifth ÷ poorest fifth |
|---|---|---|
| 1 | Wine | 3.76× |
| 2 | Medicines and health products | 2.83× |
| 3 | Pet food, pet supplies and vet bills | 2.54× |
| 4 | Newspapers, magazines and books | 2.29× |
| 5 | Coffee | 2.12× |
| 6 | Tinned and jarred vegetables | 2.07× |
| 7 | Beer and cider | 2.00× |
| 8 | Fish and seafood | 1.83× |
| 9 | Tea | 1.75× |
| 10 | Sauces, soups and seasonings | 1.72× |
| 11 | Fresh fruit | 1.71× |
| 11 | Fresh vegetables | 1.71× |
| 11 | Spirits and liqueurs | 1.71× |
| 14 | Cheese | 1.65× |
| 14 | Yoghurt and cream | 1.65× |
| 14 | Soap, toothpaste and razors | 1.65× |
| 17 | Cleaning products and washing powder | 1.44× |
| 18 | Eggs | 1.36× |
| 19 | Beef | 1.33× |
| 19 | Bread, breakfast cereal and rice | 1.33× |
| 21 | Kitchen roll, foil and bin bags | 1.32× |
| 22 | Chocolate | 1.30× |
| 23 | Chicken and other poultry | 1.28× |
| 24 | Sausages, pies and processed meat | 1.25× |
| 25 | Ice cream | 1.12× |
| 26 | Cakes, buns and biscuits | 1.11× |
| 27 | Fizzy drinks and squash | 1.04× |
| 28 | Crisps and oven chips | 0.96× |
| 29 | Milk | 0.91× |
| 30 | Tobacco | 0.31× |
Above 1, the richest fifth of households spend more on the aisle; below 1, the poorest do.
Download the chart as an image
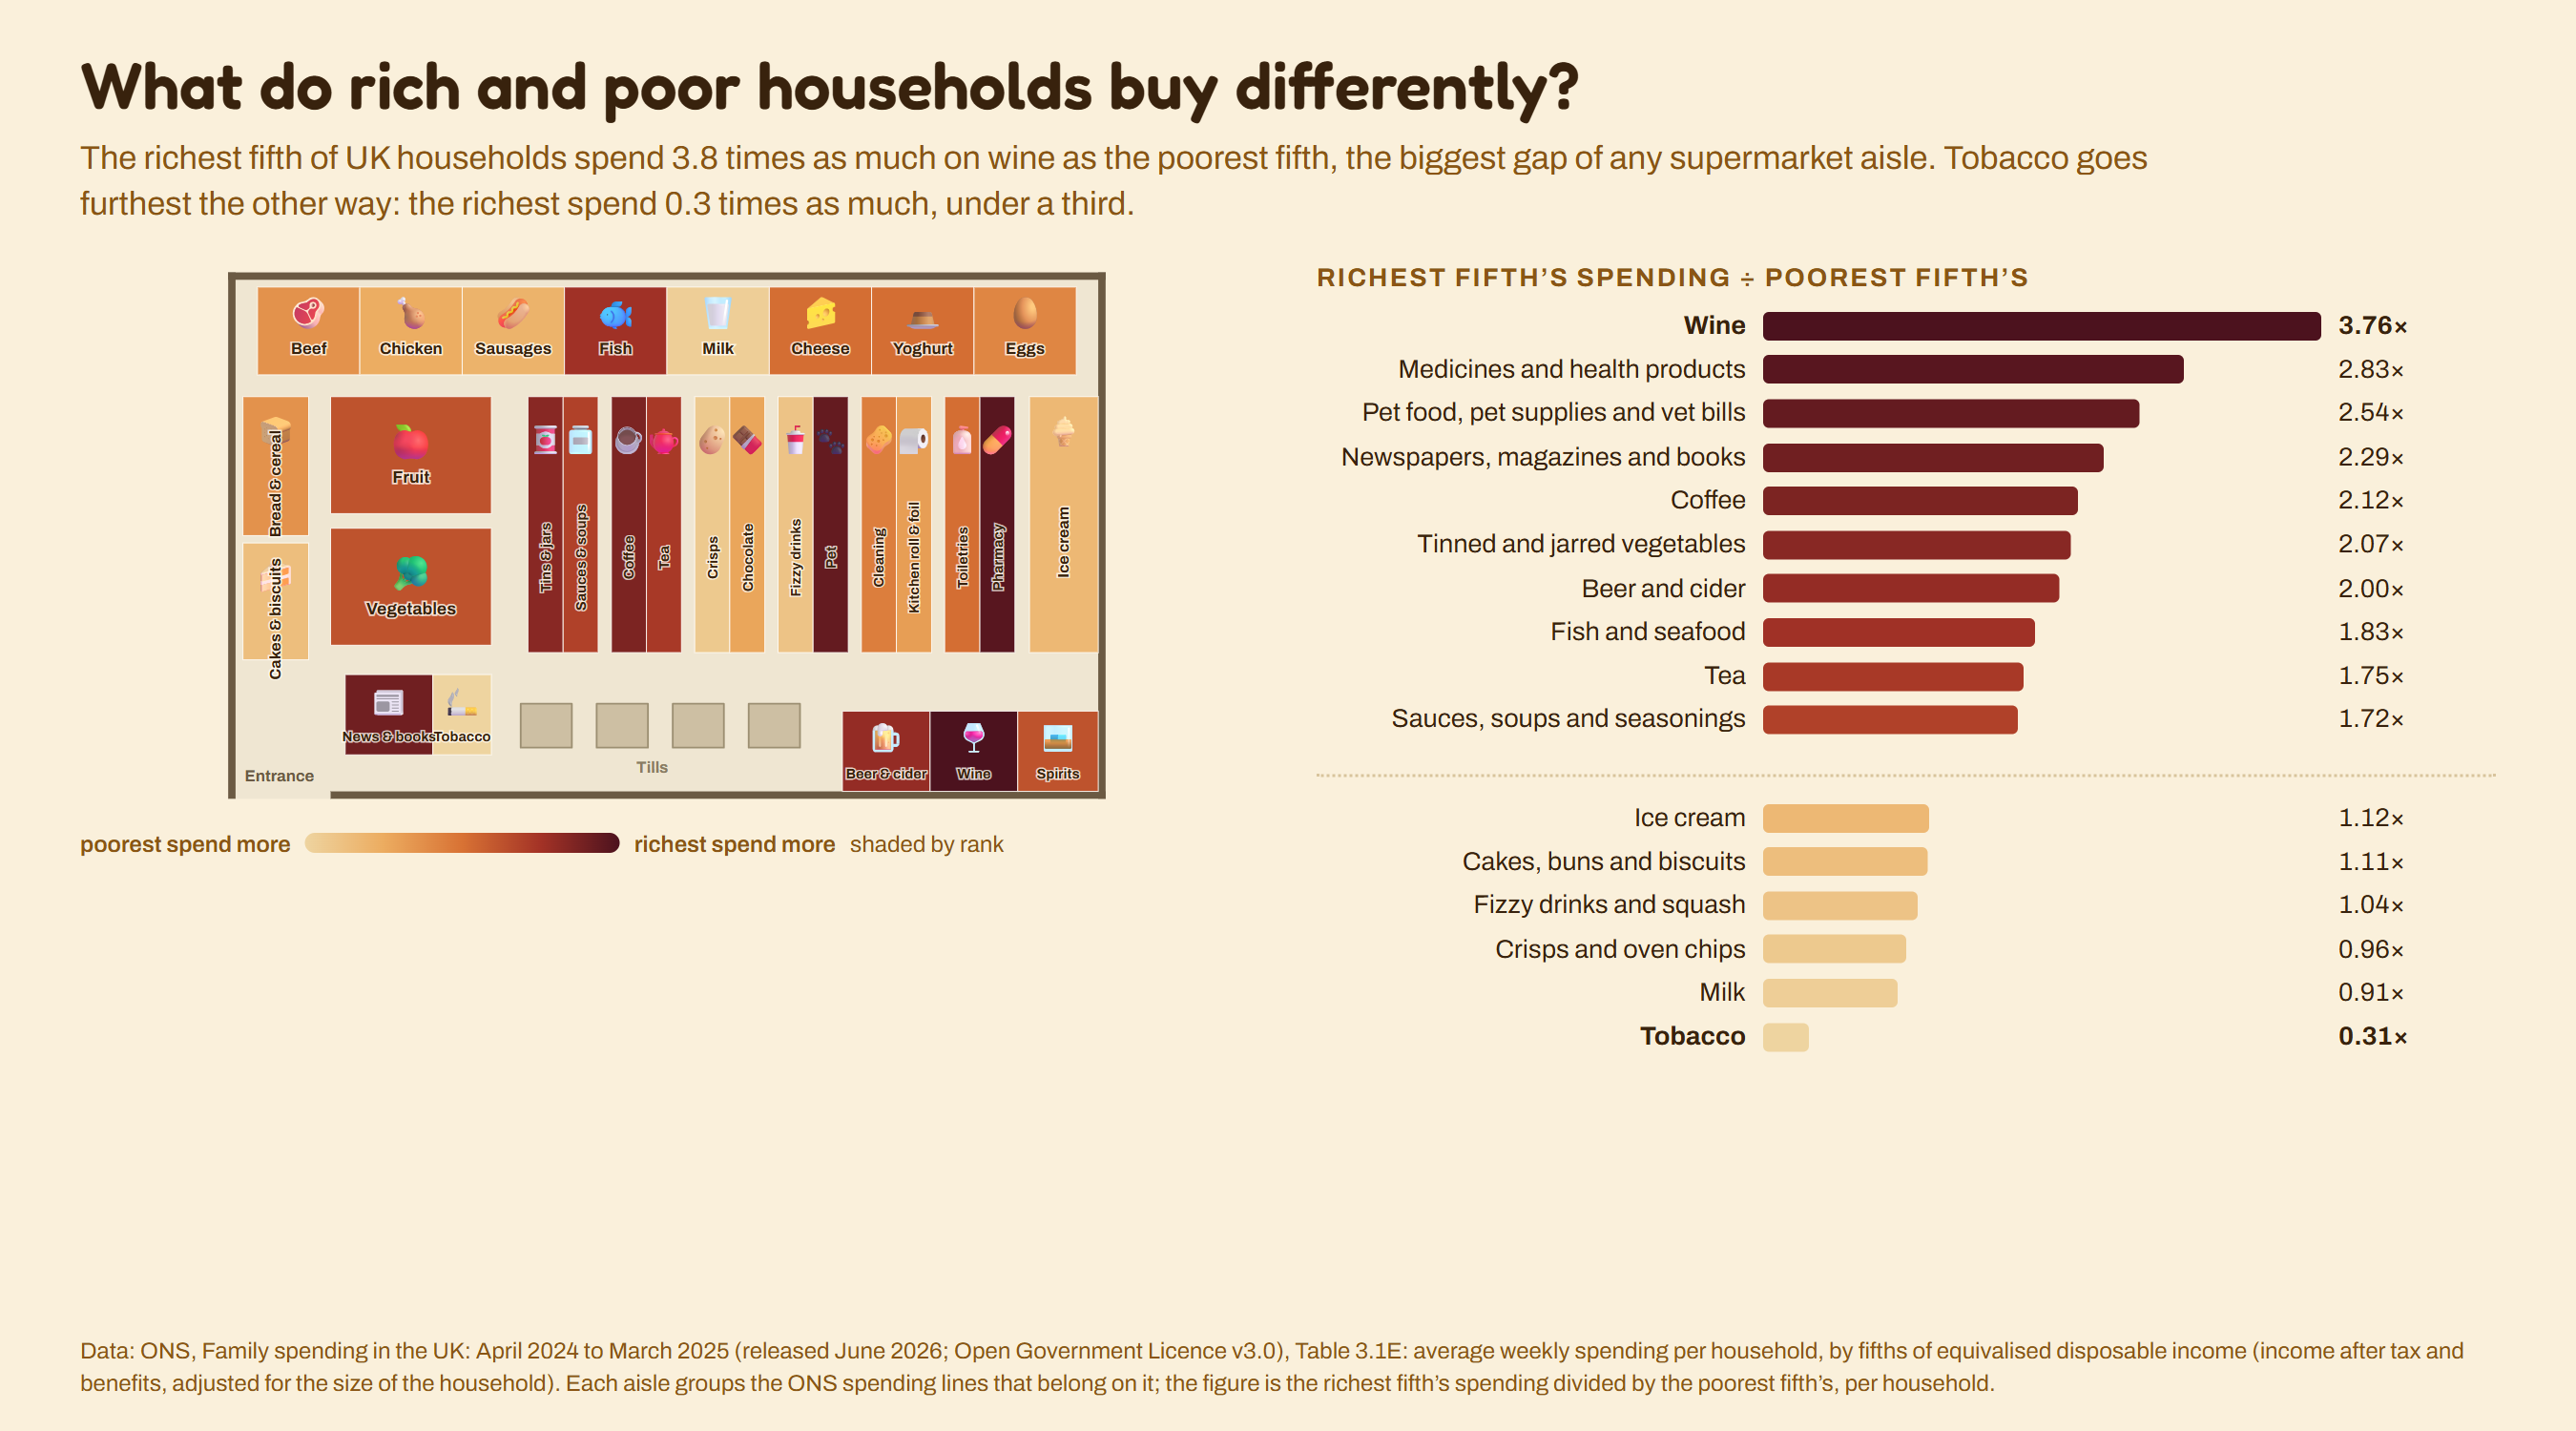
Data: ONS, Family spending in the UK: April 2024 to March 2025 (released June 2026; Open Government Licence v3.0), Table 3.1E: average weekly spending per household, by fifths of equivalised disposable income (income after tax and benefits, adjusted for the size of the household). Each aisle groups the ONS spending lines that belong on it; the figure is the richest fifth’s spending divided by the poorest fifth’s, per household. Played as puzzles in Daily Shade.