What the Elizabeth line did
Passengers at each Elizabeth line station in 2025 against 2019: about nine times as many at Acton Main Line, five times at Shenfield. Only its 29 stations are coloured.
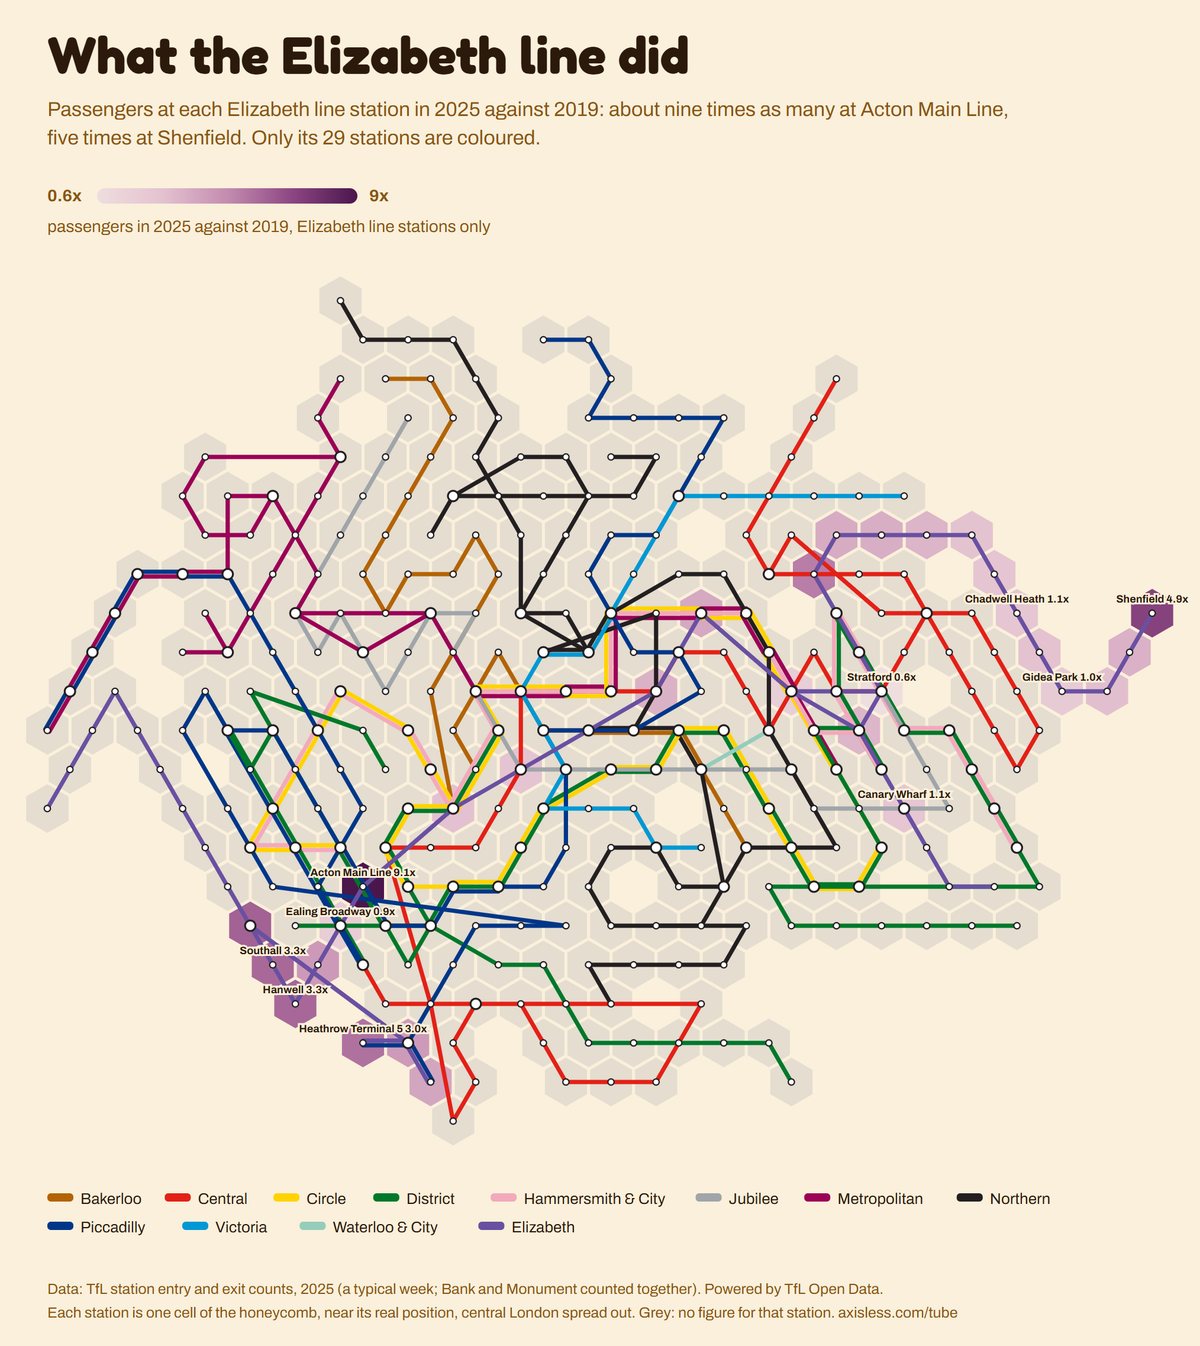
Colour: passengers in 2025 against 2019, Elizabeth line stations only. Data: TfL station entry and exit counts, 2025 (a typical week; Bank and Monument counted together). Powered by TfL Open Data.
The top 10
- Acton Main Line: 9.1x
- Shenfield: 4.9x
- Hayes & Harlington: 3.5x
- Hanwell: 3.3x
- Southall: 3.3x
- Heathrow Terminal 5: 3.0x
- Maryland: 2.7x
- West Ealing: 1.9x
- Heathrow Terminals 2 & 3: 1.9x
- Heathrow Terminal 4: 1.7x
The bottom 10
- Stratford: 0.6x
- Liverpool Street: 0.9x
- Ealing Broadway: 0.9x
- Gidea Park: 1.0x
- Canary Wharf: 1.1x
- Chadwell Heath: 1.1x
- Goodmayes: 1.1x
- Bond Street: 1.1x
- Seven Kings: 1.2x
- Romford: 1.2x
Every station, A to Z (29)
- Acton Main Line: 9.1x
- Bond Street: 1.1x
- Brentwood: 1.5x
- Canary Wharf: 1.1x
- Chadwell Heath: 1.1x
- Ealing Broadway: 0.9x
- Farringdon: 1.6x
- Forest Gate: 1.6x
- Gidea Park: 1.0x
- Goodmayes: 1.1x
- Hanwell: 3.3x
- Harold Wood: 1.2x
- Hayes & Harlington: 3.5x
- Heathrow Terminal 4: 1.7x
- Heathrow Terminal 5: 3.0x
- Heathrow Terminals 2 & 3: 1.9x
- Ilford: 1.4x
- Liverpool Street: 0.9x
- Manor Park: 1.5x
- Maryland: 2.7x
- Paddington: 1.2x
- Romford: 1.2x
- Seven Kings: 1.2x
- Shenfield: 4.9x
- Southall: 3.3x
- Stratford: 0.6x
- Tottenham Court Road: 1.4x
- West Ealing: 1.9x
- Whitechapel: 1.4x
More maps of the Tube
- Airbnb London
- Barbers and hairdressers by the Tube
- Buses at the Tube
- Car-free London, station by station
- Chicken shops by the Tube
- Churches, mosques, temples and synagogues
- Coffee by the Tube
- Coffee London, pub London
- Council and housing association homes
- English as a main language
- Flats or houses?
- Graduate London, station by station
- Gyms by the Tube
- Has the Tube got its passengers back?
- Hotel London
- Household income by the Tube
- Households with children
- How busy is each Tube station?
- How crowded is the neighbourhood?
- How deep is the Tube?
- How far apart are the stations?
- How far from the river?
- How far is Oxford Circus?
- How far to a big park?
- How far to the nearest Boots?
- How far to the nearest canal?
- How far to the nearest chicken shop?
- How far to the nearest cinema?
- How far to the nearest Costa?
- How far to the nearest Five Guys?
- How far to the nearest Greggs?
- How far to the nearest Leon?
- How far to the nearest McDonald's?
- How far to the nearest museum?
- How far to the nearest Nando's?
- How far to the nearest Pret?
- How far to the nearest Sainsbury's?
- How far to the nearest Spoons?
- How far to the nearest Starbucks?
- How far to the nearest swimming pool?
- How far to the nearest Tesco?
- How far to the nearest theatre?
- How far to the nearest Wagamama?
- How far to the nearest Waitrose?
- How much quieter is Sunday than Saturday?
- How old is the neighbourhood?
- London's Saturday night
- London's weekend Tube
- London's working-from-home Fridays
- Married London
- Old London by the Tube
- Pubs by the Tube
- Short of a bedroom
- Student London
- The air at the Tube
- The hills under the Tube
- The parks along the Tube
- Top marks for hygiene
- Tree-lined London
- Waitrose or Lidl?
- What a home costs by each Tube station
- When each Tube station opened
- Where London changes trains
- Where London goes out on a weeknight
- Where London leaves work
- Where London sets off from in the morning
- Where London’s newcomers live
- Where older Londoners live
- Where prices rose most since 2000
- Where the children are
- Where the Chinese restaurants are
- Where the Indian restaurants are
- Where the Turkish restaurants are
- Where you can pick up a Santander bike
- Which stations does the world look up?
- Who lived here? Blue plaques by the Tube
- Who lives alone?
- Who owns their home?
- Who says their health is very good?
- Who walks to work?
- Who worked from home in lockdown?