Where London changes trains
Changes between lines as a share of all the movements at each station: seven in ten at Stockwell and Kennington, where the change is across the platform. Grey: stations where nobody changes between Tube lines.
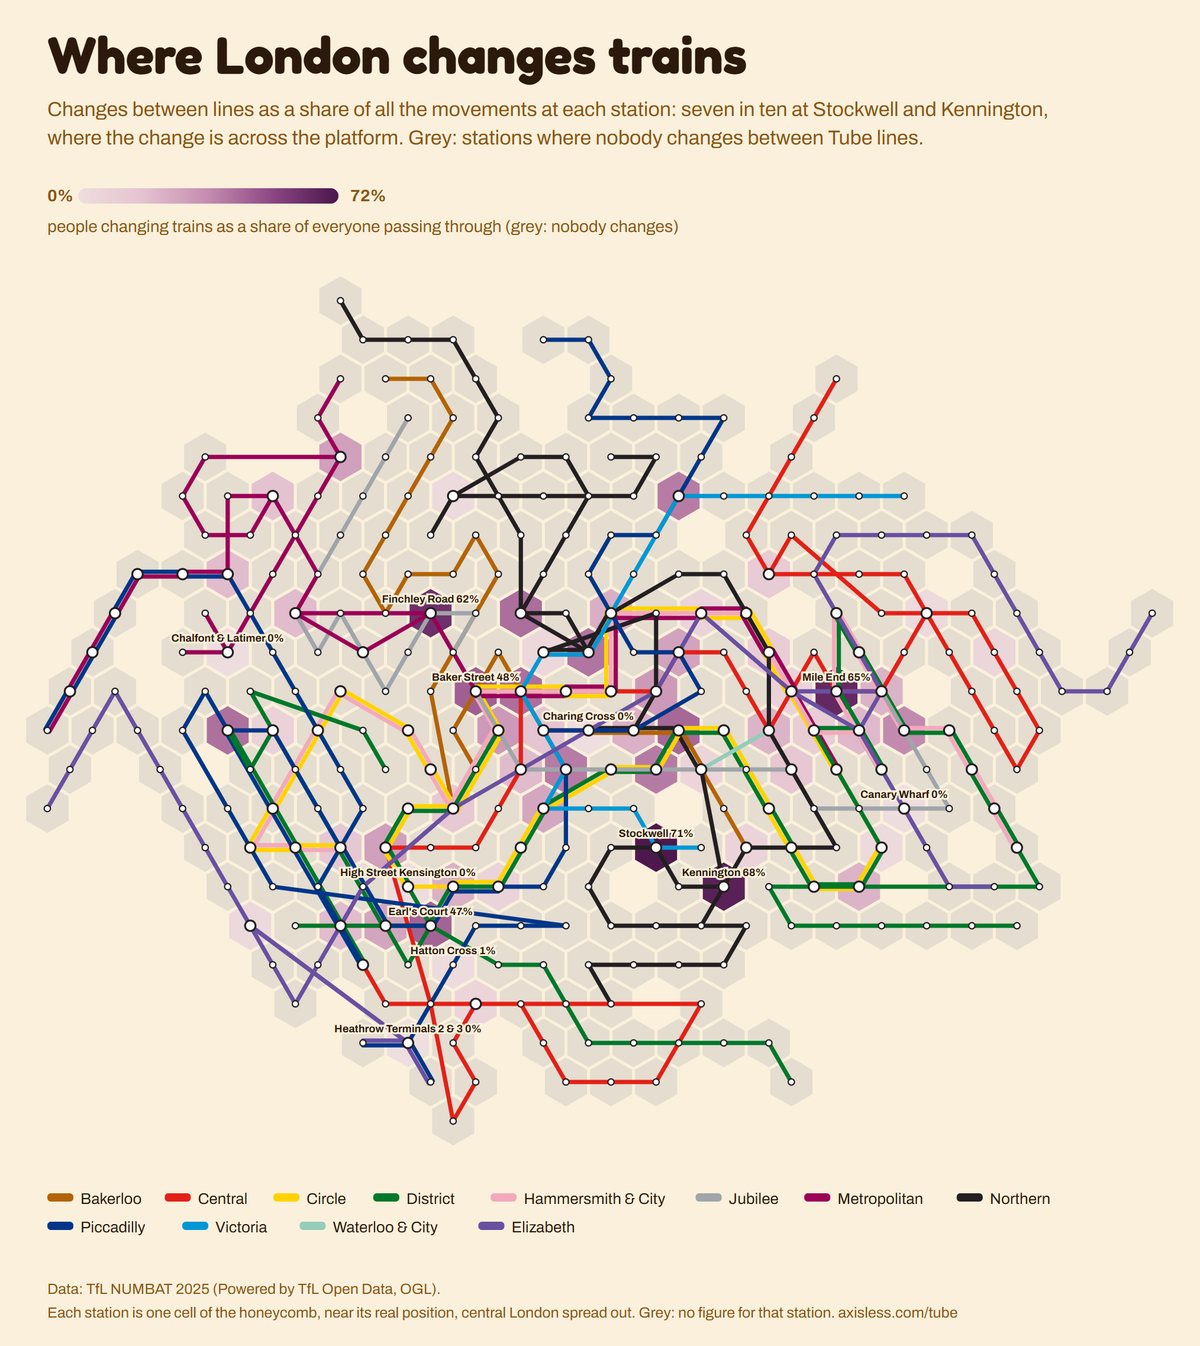
Colour: people changing trains as a share of everyone passing through (grey: nobody changes). Data: TfL NUMBAT 2025 (Powered by TfL Open Data, OGL).
The top 10
- Stockwell: 71%
- Kennington: 68%
- Mile End: 65%
- Finchley Road: 62%
- Baker Street: 48%
- Earl's Court: 47%
- Embankment: 45%
- Camden Town: 44%
- Oxford Circus: 43%
- Acton Town: 43%
The bottom 10
- Heathrow Terminals 2 & 3: 0%
- Charing Cross: 0%
- Canary Wharf: 0%
- Chalfont & Latimer: 0%
- High Street Kensington: 0%
- Hatton Cross: 1%
- Tower Hill: 2%
- Finchley Central: 3%
- Leytonstone: 3%
- Hayes & Harlington: 3%
Every station, A to Z (60)
- Acton Town: 43%
- Aldgate East: 11%
- Baker Street: 48%
- Bank: 23%
- Barons Court: 28%
- Bond Street: 20%
- Camden Town: 44%
- Canary Wharf: 0%
- Chalfont & Latimer: 0%
- Charing Cross: 0%
- Ealing Broadway: 20%
- Earl's Court: 47%
- Edgware Road: 32%
- Elephant & Castle: 7%
- Embankment: 45%
- Euston: 42%
- Farringdon: 6%
- Finchley Central: 3%
- Finchley Road: 62%
- Finsbury Park: 40%
- Gloucester Road: 24%
- Green Park: 40%
- Hainault: 5%
- Hammersmith: 14%
- Harrow-on-the-Hill: 17%
- Hatton Cross: 1%
- Hayes & Harlington: 3%
- Heathrow Terminals 2 & 3: 0%
- High Street Kensington: 0%
- Holborn: 28%
- Kennington: 68%
- King's Cross St. Pancras: 24%
- Leicester Square: 24%
- Leytonstone: 3%
- Liverpool Street: 7%
- London Bridge: 15%
- Mile End: 65%
- Monument: 23%
- Moor Park: 29%
- Moorgate: 11%
- North Acton: 6%
- Notting Hill Gate: 30%
- Oxford Circus: 43%
- Paddington: 14%
- Piccadilly Circus: 16%
- Rayners Lane: 20%
- South Kensington: 6%
- Stockwell: 71%
- Stratford: 23%
- Tottenham Court Road: 32%
- Tower Hill: 2%
- Turnham Green: 8%
- Victoria: 27%
- Warren Street: 4%
- Waterloo: 6%
- Wembley Park: 20%
- West Ham: 36%
- Westminster: 40%
- Whitechapel: 21%
- Woodford: 12%
More maps of the Tube
- Airbnb London
- Barbers and hairdressers by the Tube
- Buses at the Tube
- Car-free London, station by station
- Chicken shops by the Tube
- Churches, mosques, temples and synagogues
- Coffee by the Tube
- Coffee London, pub London
- Council and housing association homes
- English as a main language
- Flats or houses?
- Graduate London, station by station
- Gyms by the Tube
- Has the Tube got its passengers back?
- Hotel London
- Household income by the Tube
- Households with children
- How busy is each Tube station?
- How crowded is the neighbourhood?
- How deep is the Tube?
- How far apart are the stations?
- How far from the river?
- How far is Oxford Circus?
- How far to a big park?
- How far to the nearest Boots?
- How far to the nearest canal?
- How far to the nearest chicken shop?
- How far to the nearest cinema?
- How far to the nearest Costa?
- How far to the nearest Five Guys?
- How far to the nearest Greggs?
- How far to the nearest Leon?
- How far to the nearest McDonald's?
- How far to the nearest museum?
- How far to the nearest Nando's?
- How far to the nearest Pret?
- How far to the nearest Sainsbury's?
- How far to the nearest Spoons?
- How far to the nearest Starbucks?
- How far to the nearest swimming pool?
- How far to the nearest Tesco?
- How far to the nearest theatre?
- How far to the nearest Wagamama?
- How far to the nearest Waitrose?
- How much quieter is Sunday than Saturday?
- How old is the neighbourhood?
- London's Saturday night
- London's weekend Tube
- London's working-from-home Fridays
- Married London
- Old London by the Tube
- Pubs by the Tube
- Short of a bedroom
- Student London
- The air at the Tube
- The hills under the Tube
- The parks along the Tube
- Top marks for hygiene
- Tree-lined London
- Waitrose or Lidl?
- What a home costs by each Tube station
- What the Elizabeth line did
- When each Tube station opened
- Where London goes out on a weeknight
- Where London leaves work
- Where London sets off from in the morning
- Where London’s newcomers live
- Where older Londoners live
- Where prices rose most since 2000
- Where the children are
- Where the Chinese restaurants are
- Where the Indian restaurants are
- Where the Turkish restaurants are
- Where you can pick up a Santander bike
- Which stations does the world look up?
- Who lived here? Blue plaques by the Tube
- Who lives alone?
- Who owns their home?
- Who says their health is very good?
- Who walks to work?
- Who worked from home in lockdown?